 |
Inquiry into the M5 East Ventilation Stack (2001)
NSW Legislative Council (Upper House) General
Purpose Standing Committee No. 5
Day 1 Public Hearing, Tuesday 01 May 2001
Air Quality Modelling presented by Dr Peter Manins, CSIRO
Division of Atmospheric Physics
Video and Pollution Maps
are further down on this page...
|
The submission by the CSIRO to the Inquiry into the M5 East Ventilation
Stack (2001) followed an invitation to give evidence to the Parliamentary
Inquiry about issues raised in their report, in response to the Department
of Urban Affairs and Planning and the RTA about the stack height.
Excerpts of Modelling presented
by Dr Peter Manins (CSIRO) at the Inquiry
 The
results are from TAPM, an advanced 3d modelling system that CSIRO developed
over several years and has made available to consultants and agencies for
air pollution modelling in complex conditions.
The
results are from TAPM, an advanced 3d modelling system that CSIRO developed
over several years and has made available to consultants and agencies for
air pollution modelling in complex conditions.
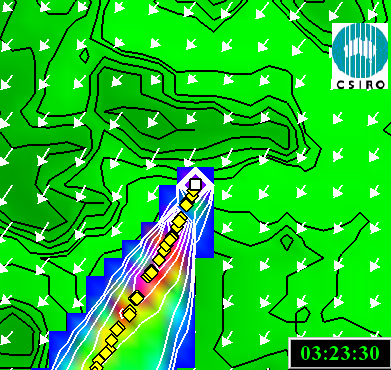
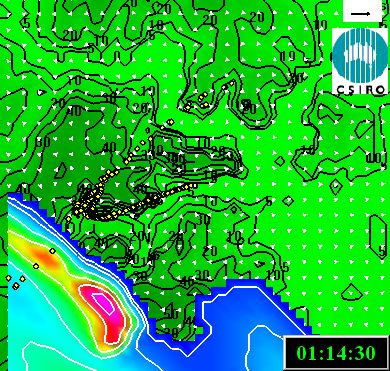
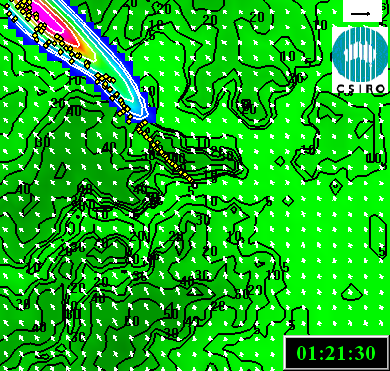
The images show expected pollution impact of nitrogen oxides at ground
level from the M5 East exhaust stack plume. The modelling was as
near to realistic as possible, and correctly describes the hour-by-hour
changes for the meteorology and interaction of the plume with the terrain.
The simulation is for mid March 2000 (had the stack been in operation at
that time). The period in March was chosen because it was likely
to have led to severe impacts in the region.
AVI Video and bitmap slides provided by CSIRO. 256 Colour GIF
images of slides displayed on this page produced by RAPS for smaller file
size. The CSIRO supplied bitmaps are attached to the slides.
Compression of 3D AVI produced by RAPS.
Legend
-
The green contours are of land height and
show the Wolli Creek Valley and Cooks River Valley
-
The coloured contours are of pollution concentrations on the ground, with
pink
being high concentrations
-
The yellow diamonds show the path of the plume
at the time
-
The clock in the lower right corner shows the day number (day 1 = 14 March
2000), and time of day in hours:minutes
The images for 5km accross show the plume in an expanded region of 5 km
across, and show that the impacts from the plume can occur at considerable
distances from the stack in rare conditions.

Video
If viewing the AVI video in a browser, you may need to click on the image
after downloading to start.
Slides (2km accross)
-
These images are displayed in 256 colours for reduced file size.
Linked images are in full colour.
Slides (5km accross)
-
The images show the plume in an expanded region of 5 km across, and show
that the impacts from the plume can occur at considerable distances from
the stack in rare conditions.
-
These images are displayed in 256 colours for reduced file size.
Linked images are in full colour.
Residents
Against
Polluting
Stacks
Inc. (RAPS) website
address is nostack.8m.com